A couple of months ago, I looked at the issue (and lack) of actigraphy in the PACE trial. Another objective measure used in the trial was a step test, which was used to assess the fitness of participants at baseline and throughout the trial. However, like actigraphy, the results of this test never made it into the main trial reports, and only appeared as a small graph in a more obscure paper on mediation analysis in The Lancet Psychiatry.
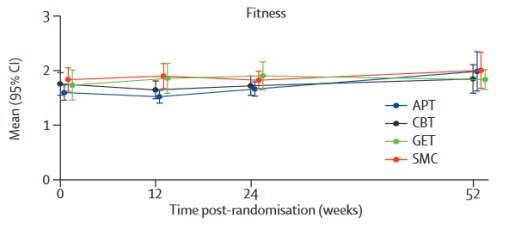
As can be seen from the figure, fitness did not change either between groups or over the course of the trial, indicating that participants weren’t particularly deconditioned (it would have been useful to have a healthy comparison group score), or indeed helped by any of the therapies offered.
When interested patients asked for the data behind this graph so that they could look at it in more detail, their requests were turned down as “vexatious”.
So I’ve tried to look into this a bit further to work out what might have been going on.
The first thing is that the details provided about the test are very scant. This is what appears in the appendix of the paper cited above:
Self-paced step test of physical fitnessThe self-paced step test of fitness involves timing participants while they do 20 step-ups and step-downs (of two steps each), as well as gathering resting and post-exercise heart rates (10). A measure of fitness was calculated as [Body Mass (in kilograms) x 9.81 x total step height (in metres) x 20] / time (in seconds) / %HRR, where %HRR = [(highest measured HR – resting HR) / (predicted max HR – resting HR)] x 100 (11) .10. Petrella RJ, Koval JJ, Cunningham DA, Paterson DH. A self-paced step test to predict aerobic fitness in older adults in the primary care clinic. J Am Geriatr Soc. 2001;49(5):632-8.
11. James D. Formula for fitness. University of Gloucestershire: Research Faculty of Sport, Health & Social Care 2012.
The Petrella reference is mentioned in the main PACE trial paper, and does seem to describe a step test that is similar to the one described above. However, this test has never been validated in the population studied, and wasn’t even validated by Petrella et al. until relatively recently (only just before publication of this PACE paper), and only in older adults.
This test was designed to give a result that gives an estimated value of maximal aerobic capacity (VO₂max). If the authors of the PACE trial had actually read the Petrella paper, they would have noted that if you include subjects who are not healthy, any correlation between the test and actual VO₂max is lost.
Another issue is that, to work effectively, even though it is self-paced, the pace adopted needs to be moderate or high to get a good approximation to VO₂max.
Instead of using the equation provided by Petrella et al. (which also adjusted for age and sex), the PACE investigators seem to have used a different equation, provided by Professor David James (I was unable to track down this reference, so again have no idea whether this equation is even appropriate to use in an unhealthy population). But confusingly, while the James equation cited gives results that are generally below 1, the results in the graph are between 1.4 and 2.15. I’ve tried various ways to get this range of results, but I simply cannot work out what they have done. [If anyone has any ideas – let me know!]
The James equation is also sensitive to a change in pace adopted by the subject, and will record a poor score if the test is carried out at a slower pace.
This is concerning, because this is exactly what participants were asked to do, because of the effect the test had on one participant from Edinburgh (as noted in the Trial Management Group meeting minutes):
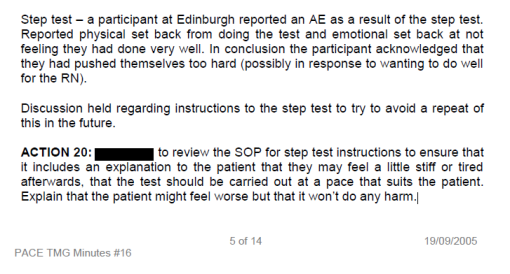
That a third of participants did not provide complete data on this test is also a concern. (Note that the test is equivalent to ascending and descending three flights of stairs.) And as with the 6-minute walking test, it is likely that data were not missing at random – those who didn’t complete the test were more physically hampered than those who did.
So what does all this mean?
It’s really difficult to say. Taken at face value, it says that fitness was not improved in any group as a result of the trial – ie the trial was a failure. But I’m not sure we can even say that, because the way the test was done, and the problems that the participants faced by doing it, and the problems evident in analysing it (due to missing data) make it very hard to draw any conclusions at all.
Ultimately, a waste of everyone’s time and energy.

A waste of time, energy AND a lot of money!
Is it right that they wouldn’t even release the data that created this graph? All very strange.
[…] Recently, another ME patient, John Peters, acquired the minutes of the PACE trial steering and management committees through a Freedom of Infomation Act request. What was particularly interesting in these minutes was the issues that arose around actigraphy and the other objective measures being assessed during the trial (including the step test – although I’ll deal with this in another post). […]